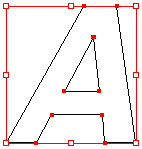
Difference Between Vector and Raster image
There are two kinds of computer graphics - raster (composed of pixels) and vector (composed of paths). Raster images are more commonly called bitmap images.
A bitmap image uses a grid of individual pixels where each pixel can be a different color or shade. Bitmaps are composed of pixels.
Vector graphics use mathematical relationships between points and the paths connecting them to describe an image. Vector graphics are composed of paths.
The image to the left below is representative of a bitmap and the image to the right is representative of a vector graphic. They are shown at four times actual size to exaggerate the fact that the edges of a bitmap become jagged as it is scaled up:
Bitmap Image: | Vector Graphic: |
With Adobe® Systems' introduction of the PostScript® page-description language computers could display fonts and images using point-to-point math rather than by pixels alone. The advantage to using a page-description language such as PostScript becomes clear when you scale an image up. The larger you display a bitmap, the more jagged it appears, while a vector image remains smooth at any size. That is why PostScript and TrueType® fonts always appear smooth - they are vector-based.
The jagged appearance of bitmap images can be partially overcome with the use of "anti-aliasing". Anti-aliasing is the application of subtle transitions in the pixels along the edges of images to minimize the jagged effect (below left). A scalable vector image will always appear smooth (below right):
The jagged appearance of bitmap images can be partially overcome with the use of "anti-aliasing". Anti-aliasing is the application of subtle transitions in the pixels along the edges of images to minimize the jagged effect (below left). A scalable vector image will always appear smooth (below right):
Anti-Aliased Bitmap Image: | Smooth Vector Image: |
Bitmap images require higher resolutions and anti-aliasing for a smooth appearance. Vector-based graphics on the other hand are mathematically described and appear smooth at any size or resolution.
Bitmaps are best used for photographs and images with subtle shading. Graphics best suited for the vector format are page layout, type, line art or illustrations.
Wherever possible use the vector format for all your type, line art and illustrations and only use bitmaps for photos or images with complex or non-uniform shading. If the graphics application recognizes native vector files such as those created by Deneba Canvas™ (a filename with an extension of .CNV- for versions 6 and 7), Adobe Illustrator® (a filename with an extension of .AI), CorelDRAW® (a filename with an extension of .CDR), or Macromedia® FreeHand® (a filename with an extension of .FH8 - for version 8), then use them first.
Wherever possible use the vector format for all your type, line art and illustrations and only use bitmaps for photos or images with complex or non-uniform shading. If the graphics application recognizes native vector files such as those created by Deneba Canvas™ (a filename with an extension of .CNV- for versions 6 and 7), Adobe Illustrator® (a filename with an extension of .AI), CorelDRAW® (a filename with an extension of .CDR), or Macromedia® FreeHand® (a filename with an extension of .FH8 - for version 8), then use them first.
The EPS File Format
If the graphics application you are using cannot read native vector files the next best thing would be to save them as EPS (Encapsulated PostScript) files. These are self-contained PostScript files which contain the same mathematical descriptions as the vector files they are made from. Even bitmaps can be saved in the EPS file format. EPS files are supported by most all graphics applications. It is the most portable format for this reason. It is best to use EPS files for all line art and illustrations because they can be reproduced at any size or resolution and still display exactly as they were drawn. Use them wherever native vector files cannot be used.
A Little of Both In Today's Applications
Today's graphic artist has to master both skills - image editing and illustration. In fact, Adobe Photoshop® - an image editor - incorporates vector based paths which can be exported as native vector files. Four of the major illustration programs - Deneba Canvas, Adobe Illustrator, CorelDRAW and Macromedia Freehand - allow bitmaps to be embedded in the vector files they create.
I believe that the ideal page layout program of the future would be primarily a vector-based application which would create, import, display and print native vector objects side by side with bitmaps. As computing power becomes more affordable I believe this will happen.

Comments
Post a Comment